Photo: The Official CTBTO Photostream (CC BY 2.0)
Job description
The work starts with pulling and cleaning data from multiple systems, then writing queries to extract exactly what's needed from a relational database. From there, analysts build dashboards that track key metrics, run statistical analysis to answer specific business questions, and present findings in plain language to stakeholders who aren't technical themselves. Deadlines cluster around reporting cycles, but the role is largely self-directed once a question has been assigned, and it commonly serves as a stepping stone into more advanced data science or data engineering work.
Pros
- Common entry point into more advanced data science or data engineering careers
- Steady, mostly independent work once assigned a question, with real ownership of the analysis
- Broadly applicable skill set in SQL, dashboards, and statistics useful across nearly every industry
Cons
- Pay tops out at $120k, modest relative to more specialized data science roles
- Periodic deadline crunches cluster around recurring reporting cycles
- Almost entirely desk-bound, computer-based work with little variety in physical setting
A typical day
The Monday metrics review sets the week's questions: why did signups dip in the Midwest region? The analyst's morning is spent finding out — SQL queries joining three tables, a cohort comparison, and the discovery that a tracking change, not a real decline, explains the dip. That finding, delivered before anyone panicked, is the job's quiet value. The afternoon splits between a dashboard build for the sales team — choosing the five numbers that matter from the fifty available — and a data-cleaning slog where duplicate customer records meet their overdue reckoning. A product manager's "quick question" becomes a fifteen-minute pull and a two-sentence answer with a caveat attached, because honest caveats are what separate analysts from chart producers.
Tasks at the job
- Collect and clean raw data from multiple systems to prepare it for analysis.
- Write queries to extract and aggregate information from relational databases.
- Build dashboards and visualizations that track key business metrics.
- Identify trends and anomalies in datasets and summarize what they mean.
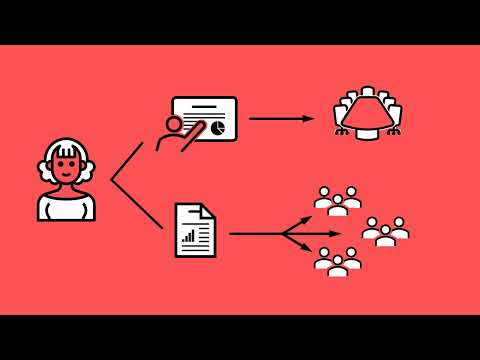
- Present findings and recommendations to non-technical stakeholders.
- Validate data quality and flag inconsistencies before reports go out.
Workplace & working conditions
Work happens indoors in a climate-controlled office, almost entirely at a computer.
The pace is steady with periodic deadline crunches around reporting cycles, and you're expected to work independently once given a question to answer. Precision matters since flawed numbers can steer real business decisions.
Education necessary or common
Bachelor's degree in statistics, economics, computer science, or a related field
Common college majors
Licenses & certifications
- Google Data Analytics Certificate (entry-level)
- Tableau/Power BI certifications (helpful)
Career path
Related fields
Courses to take
- AP Statistics — the discipline's core; take it seriously
- AP Computer Science Principles or A — SQL and Python live nearby
- Algebra II/Precalculus — the quantitative floor
- Economics — business context makes analysis useful
- English — findings that can't be communicated don't count
Clubs, activities & competitions
- Math team
- Coding club — ask for a data project
- Sports team statistician — real data, real stakeholders
- Science fair with a data-analysis project
- FBLA data analysis events
First steps you can take now
- Learn spreadsheet pivot tables this week — analyze your own screen-time or spending data
- Take a free SQL tutorial and query a practice database
- Find a public dataset about something you love and answer one question with it
- Make one chart that tells a story honestly, then improve it